How to Debug Choreonoid Using Visual Studio Code
This section explains how to debug Choreonoid programs using Visual Studio Code.
This document describes a debugging method that combines GNU Debugger (GDB) with Microsoft’s C/C++ extension. When debugging Choreonoid built with gcc on Linux, this combination is the most stable and feature-rich.
Installing Visual Studio Code and the Extension
First, install Visual Studio Code itself, and then install the C/C++ extension. You only need to do this once; you will not need to repeat it for subsequent debugging work.
Installing Visual Studio Code
If you are already using Visual Studio Code, you can use your existing installation.
Here we describe the case of installing Visual Studio Code on Ubuntu 24.04 LTS (64-bit).
Open the Visual Studio Code home page at https://azure.microsoft.com/en-us/products/visual-studio-code and click the Download VS Code button.
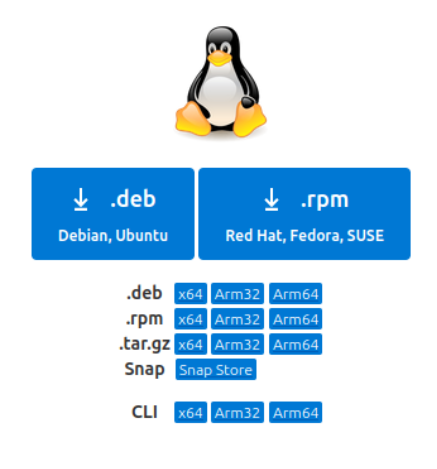
On the download page that appears, click the .deb Debian, Ubuntu button to download the .deb file (for example, code_1.102.0-1752099874_amd64.deb).
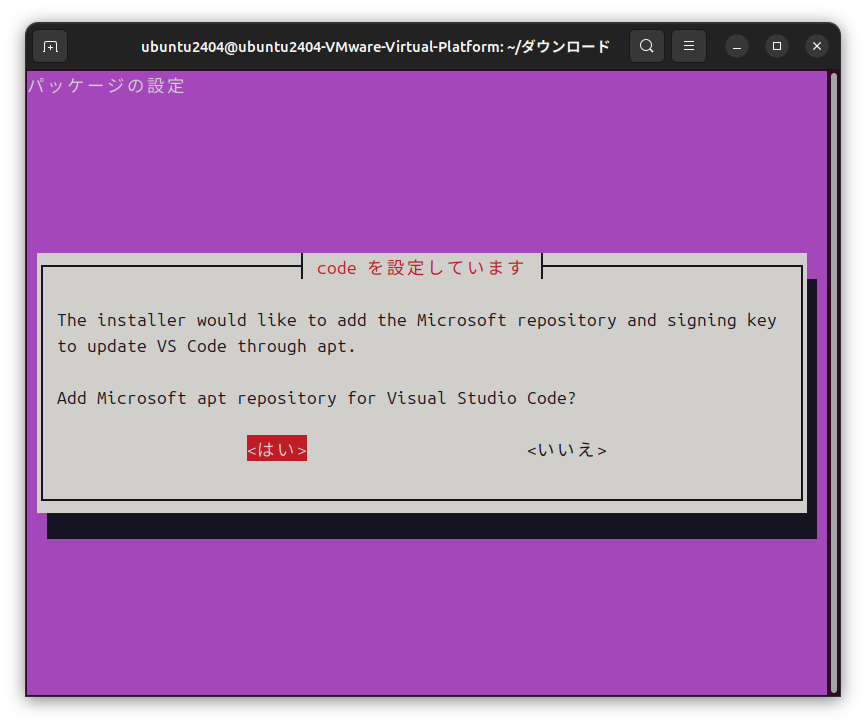
Open a terminal in the directory where the .deb file was saved, and run
sudo dpkg -i code_1.102.0-1752099874_amd64.deb
to start the installation (replace the filename according to the version you downloaded). Follow the installer’s instructions. If the following screen appears during installation, select either <Yes>/<No> to continue the installation.
Installing the C/C++ Extension
Launch Visual Studio Code. Open a terminal and run
code
to launch Visual Studio Code.
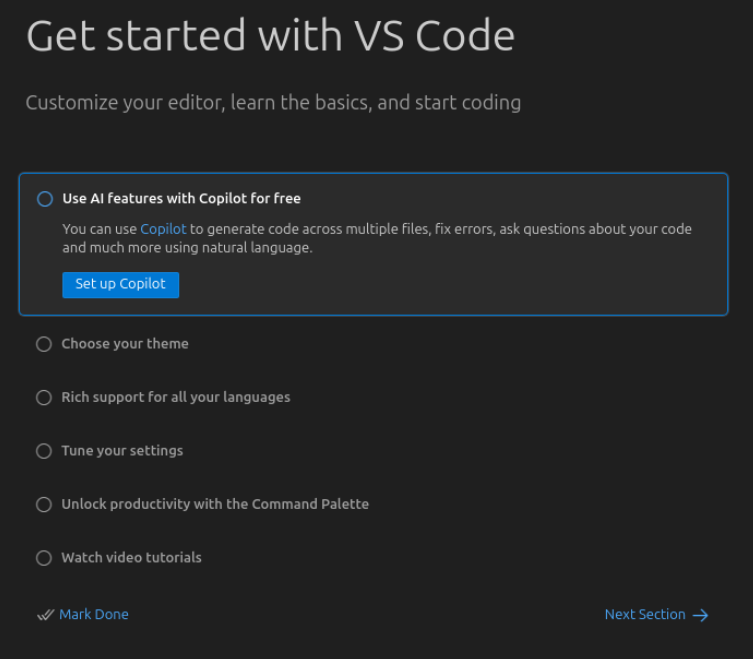
If you do not need to change any settings, press the Mark Done button to complete the initial setup.
Next, install the C/C++ extension in Visual Studio Code. Click the Extensions (Ctrl+Shift+K) button on the left side of the window, search for C/C++ in the search bar at the top of the EXTENSIONS panel, and install the extension provided by Microsoft.
This extension includes a debugger (cppdbg) that allows you to use GDB from Visual Studio Code.
Note
There are many other extensions for debugging C/C++ in Visual Studio Code. Representative ones include CodeLLDB, which uses LLDB, Native Debug, which provides a lightweight GDB interface, and GDB Debugger - Beyond, each with its own characteristics. In this document we adopt Microsoft’s C/C++ extension because it works most stably when debugging Choreonoid built with gcc on Linux, and we do not cover the configuration or usage of other extensions. Since the syntax of launch.json and the usability differ between extensions, refer to the documentation of each extension when using other options.
This completes the installation of Visual Studio Code and the extension.
Preparing a Debug Build of Choreonoid
To perform debugging, you need a Choreonoid executable that has been built with debug information.
We recommend performing the debug build in a different build directory from the regular release build. If you reuse the same directory for both release and debug builds, you will have to rebuild all sources every time you switch settings, which is inefficient. By keeping the directories separate, you can switch between debugging and regular use as you work, and start debugging immediately when needed.
This document explains an example in which a directory named build-debug is created directly under Choreonoid’s top directory and the debug build is performed there. All subsequent configuration and command examples also assume this directory name. If you use a different name, read accordingly.
For the overall procedure of building Choreonoid from source code, refer to Building and Installing from Source Code (Ubuntu Linux). Here we describe only the steps specific to debug builds.
First, create the build-debug directory inside Choreonoid’s top directory.
mkdir build-debug
cd build-debug
Next, run CMake in this directory to configure the build. To make it a debug build, you need to set CMAKE_BUILD_TYPE to Debug. When specifying on the command line, run cmake with the -DCMAKE_BUILD_TYPE=Debug option, like this:
cmake -DCMAKE_BUILD_TYPE=Debug ..
Alternatively, you can configure it interactively using ccmake. Run
ccmake ..
change the value of CMAKE_BUILD_TYPE to Debug, then configure and generate, and exit.
Once the CMake configuration is complete, build Choreonoid by running the following in the build-debug directory:
cmake --build .
For a parallel build, you can specify the number of parallel jobs with the –parallel option, like this:
cmake --build . --parallel <number-of-jobs>
For details of the build and other build methods, refer to Building Choreonoid.
This completes the preparation of the debug build.
Sample to Debug
Here we use the sample sample/SimpleController/SampleCrawler.cnoid bundled with Choreonoid as the target of debugging. This project is controlled by the SampleCrawlerController class, and its source code is located in sample/SimpleController/SampleCrawlerController.cpp. In the following, we set breakpoints in this controller’s code and follow the program’s behavior while checking variable values.
Creating launch.json
To perform debugging with Visual Studio Code, you need to create a file named launch.json that describes the executable to debug, the arguments to pass at startup, and so on.
First, open Choreonoid in Visual Studio Code. Press Open Folder… and specify Choreonoid’s top directory. If questions are displayed, answer them as appropriate. Here we check Trust the authors of all files in the parent folder ‘<username>’ and answer Yes, I trust the authors.
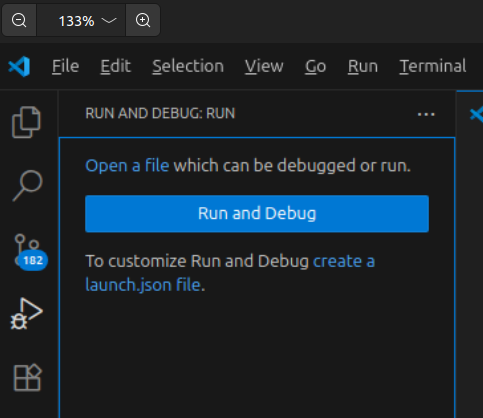
Next, create launch.json. Click the Run and Debug (Ctrl+Shift+D) button on the left side of the window, and then click create a launch json file in the RUN AND DEBUG: RUN panel.
Select C/C++: (gdb) Launch from the Select debugger menu displayed at the top of the window, and a launch.json file will be created.
The created launch.json file is saved inside Choreonoid’s top directory as follows:
- choreonoid
  +- .vscode
    +- launch.json
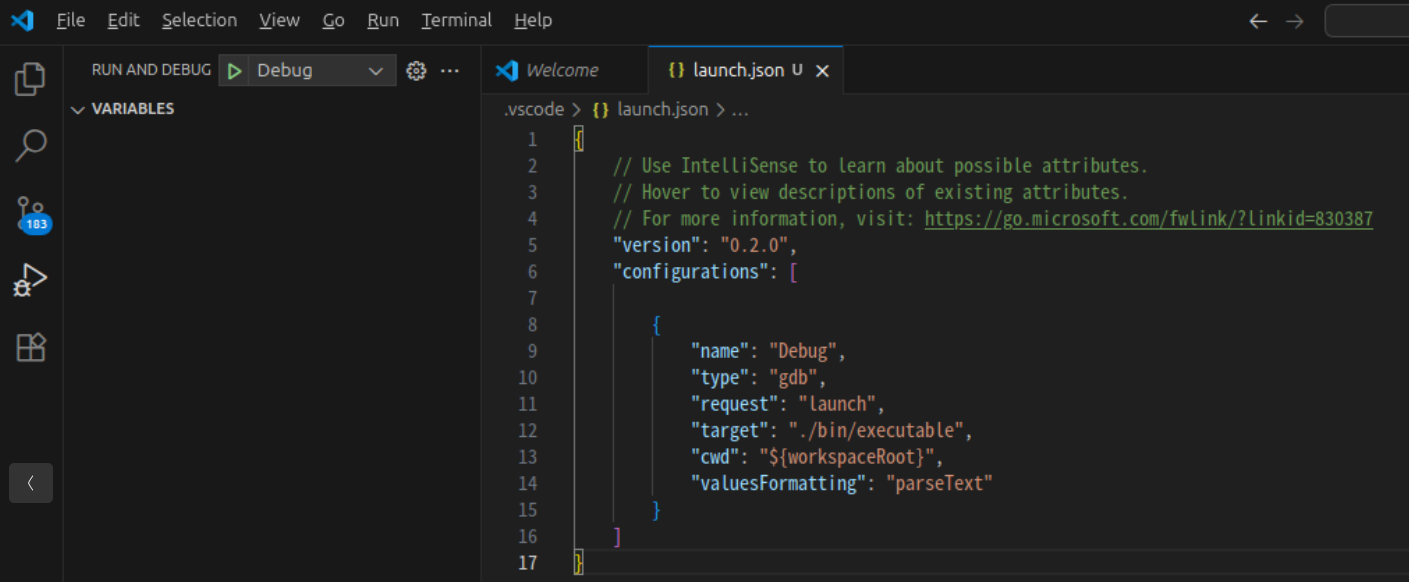
Then edit the launch.json file as follows:
{
    "version": "0.2.0",
    "configurations": [
        {
            "name": "(gdb) Launch",
            "type": "cppdbg",
            "request": "launch",
            "program": "${workspaceFolder}/build-debug/bin/choreonoid",
            "args": [ "${workspaceFolder}/sample/SimpleController/SampleCrawler.cnoid" ],
            "cwd": "${workspaceFolder}",
            "MIMode": "gdb"
        }
    ]
}
Here, program specifies the path to the Choreonoid executable to debug. args specifies the arguments to pass to Choreonoid at startup. In the example above, we specify that the sample project described earlier is loaded at startup.
This completes the configuration of launch.json. In addition to the minimal configuration created here, there are several additional settings that make debugging more comfortable. These are described in the next section, “Additional Debugging Settings.”
Additional Debugging Settings
The launch.json created so far is a minimal configuration for debugging. In addition to this, adjusting the behavior of gdb during debugging can sometimes make debugging more comfortable. This section describes such settings and how to specify them.
How to Specify Settings
The behavior of gdb during debugging can be adjusted mainly in the following ways. Depending on the type of setting, the suitable method and the method by which the setting reliably takes effect differ.
Writing in the setupCommands of launch.json : By adding a setupCommands entry to the launch.json configuration, you can specify commands to be automatically executed for gdb when debugging starts. This method applies only to that configuration. Write them as follows:
{
    "version": "0.2.0",
    "configurations": [
        {
            "name": "(gdb) Launch",
            ...
            "MIMode": "gdb",
            "setupCommands": [
                {
                    "description": "description of the command",
                    "text": "gdb command to execute",
                    "ignoreFailures": true
                }
            ]
        }
    ]
}
Each command is written in text, and description optionally describes it. Setting ignoreFailures to
trueallows debugging to continue even if the command fails.Specifying via environment variables : Settings that gdb refers to when its process starts (such as the retrieval destination of debuginfod, described later) can be controlled with environment variables. The gdb launched from Visual Studio Code inherits the environment variables of the environment (shell) in which Visual Studio Code itself was started. Therefore, write the environment variable in a shell configuration file (such as
~/.bashrcor~/.profile) and launch Visual Studio Code from that environment.Writing in ~/.gdbinit :
~/.gdbinitis a configuration file that is read first when gdb is started standalone from the command line. The settings written here apply to all gdb on the system.
Note
In debugging via the Visual Studio Code C/C++ extension (cppdbg), due to the order of debugger initialization, commands sent through setupCommands or settings written in ~/.gdbinit may not be applied in time to take effect. In particular, it has been reported that settings related to debuginfod, described later, cannot be reliably disabled with these methods. If you want to ensure that such a setting takes effect in Visual Studio Code, use the method with environment variables.
The following describes representative settings that are useful to configure.
When the First Debug Run Is Very Slow (About debuginfod)
When you run debugging for the first time without any special configuration, it may take a very long time before the Choreonoid window appears. At this time, the following kind of messages are displayed in large numbers in Visual Studio Code’s DEBUG CONSOLE:
Downloading separate debug info for /lib/x86_64-linux-gnu/libQt6Core.so.6...
Downloading separate debug info for /lib/x86_64-linux-gnu/libstdc++.so.6...
Downloading separate debug info for /lib/x86_64-linux-gnu/libX11.so.6...
(similar messages continue for many libraries)
This shows gdb retrieving the debug information of the shared libraries that the debug target depends on over the network, using a mechanism called debuginfod.
debuginfod is a mechanism that downloads the debug symbols of libraries on demand from a server provided by the Linux distribution (in the case of Ubuntu, https://debuginfod.ubuntu.com). Choreonoid depends on a large number of shared libraries such as Qt, the standard C++ library (libstdc++), and X11-related libraries, and because it tries to retrieve the debug information for all of them in turn, a large wait time occurs on the first run. Once the debug information of the system libraries is obtained through debuginfod, you can step into the internals of those libraries and display function names and line numbers in stack traces.
Debug information that has been downloaded once is cached under ~/.cache/debuginfod_client/. For this reason, on the second and subsequent debug runs, the information is read from the cache, so the wait time is not as long as on the first run. This is normal behavior. However, the time taken for the second and subsequent runs is not constant: sometimes you are barely kept waiting, and sometimes you are kept waiting to some extent. In addition, when libraries are updated by apt upgrade or the like, downloading occurs again for the updated portion, making that run slow.
Normally, if you only debug the code of Choreonoid itself or plugins that you are developing, you do not need the debug information of the internals of system libraries. In such cases, by disabling the downloading by debuginfod itself, you can make startup fast from the first run.
To disable it reliably for debugging in Visual Studio Code, use the method of making the environment variable ``DEBUGINFOD_URLS`` empty. Since debuginfod retrieves debug information from the server specified by this variable, making it empty leaves no retrieval destination, so no downloading is performed at all. Add the following to a shell configuration file (such as ~/.bashrc):
export DEBUGINFOD_URLS=""
As mentioned above, the gdb launched from Visual Studio Code inherits the environment variables of the environment in which Visual Studio Code itself was started. Therefore, after adding the above, you need to restart Visual Studio Code with the ``code`` command from a new terminal in which the setting has been applied (if you launch it from a GUI icon, write it in ~/.profile and log in again).
If you use gdb standalone only, you can also disable it by writing the setting set debuginfod enabled off in ~/.gdbinit or setupCommands. However, as mentioned above, these methods do not reliably take effect for debugging via Visual Studio Code, so the method with the environment variable is recommended.
Note that with any of these methods, only the downloading stops, and there is no problem with debugging your own code.
Displaying STL Containers and Startup Time (About -enable-pretty-printing)
When Visual Studio Code automatically generates launch.json, the setupCommands may include a command named -enable-pretty-printing. Enabling this setting has the advantage of displaying STL containers such as std::vector and std::string in a more readable form in the VARIABLES panel.
However, in applications that load many plugins such as Choreonoid, enabling this setting significantly increases the startup time and also has the side effect that the contents of base classes cannot be expanded in the variables panel. For this reason, the example configuration in this document does not include it. If you want to check the contents of STL containers, we recommend using the method described later in Displaying the Contents of STL Containers.
This completes the description of the additional settings for launch.json.
Running the Debugger
Let us actually debug the sample. Here we explain the following:
Setting breakpoints
Starting the debugger
Displaying variables
Stepping through code
Setting Breakpoints
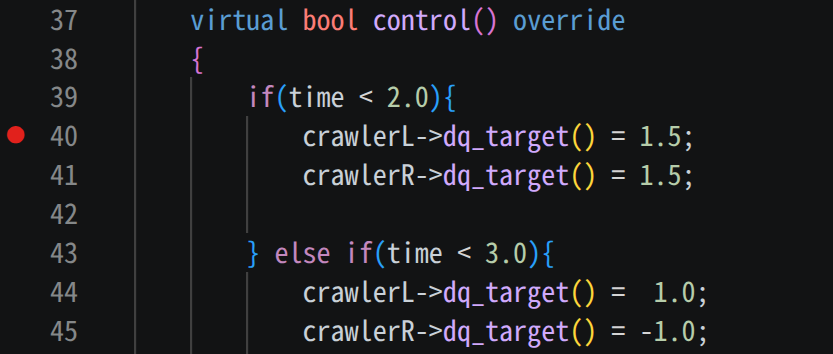
Open the file you want to debug and click on the area to the left of the line number where you want to set a breakpoint. When a breakpoint is set, a red circle appears. Here we set a breakpoint at line 40 of sample/SimpleController/SampleCrawlerController.cpp.
Starting the Debugger
Start Choreonoid in Debug mode.
Click the Run and Debug (Ctrl+Shift+D) button on the left side of the window, and then press the ▶ button at the top of the RUN AND DEBUG panel. Choreonoid will start according to the settings in launch.json. While Choreonoid is running in Debug mode, the following debug button group is displayed at the top of the Visual Studio Code window.
From left to right, the buttons are Continue (F5), Step Over (F10), Step Into (F11), Step Out (Shift+F11), Restart (Ctrl+Shift+F5), and Stop (Shift+F5).
Once Choreonoid has started, run the simulation from the simulation bar as usual.
When you run the simulation, the program pauses at the breakpoint (line 40).
Displaying Variables
When the program stops at the breakpoint, the screen appears as shown below, and a VARIABLES panel is displayed on the left side of Visual Studio Code.
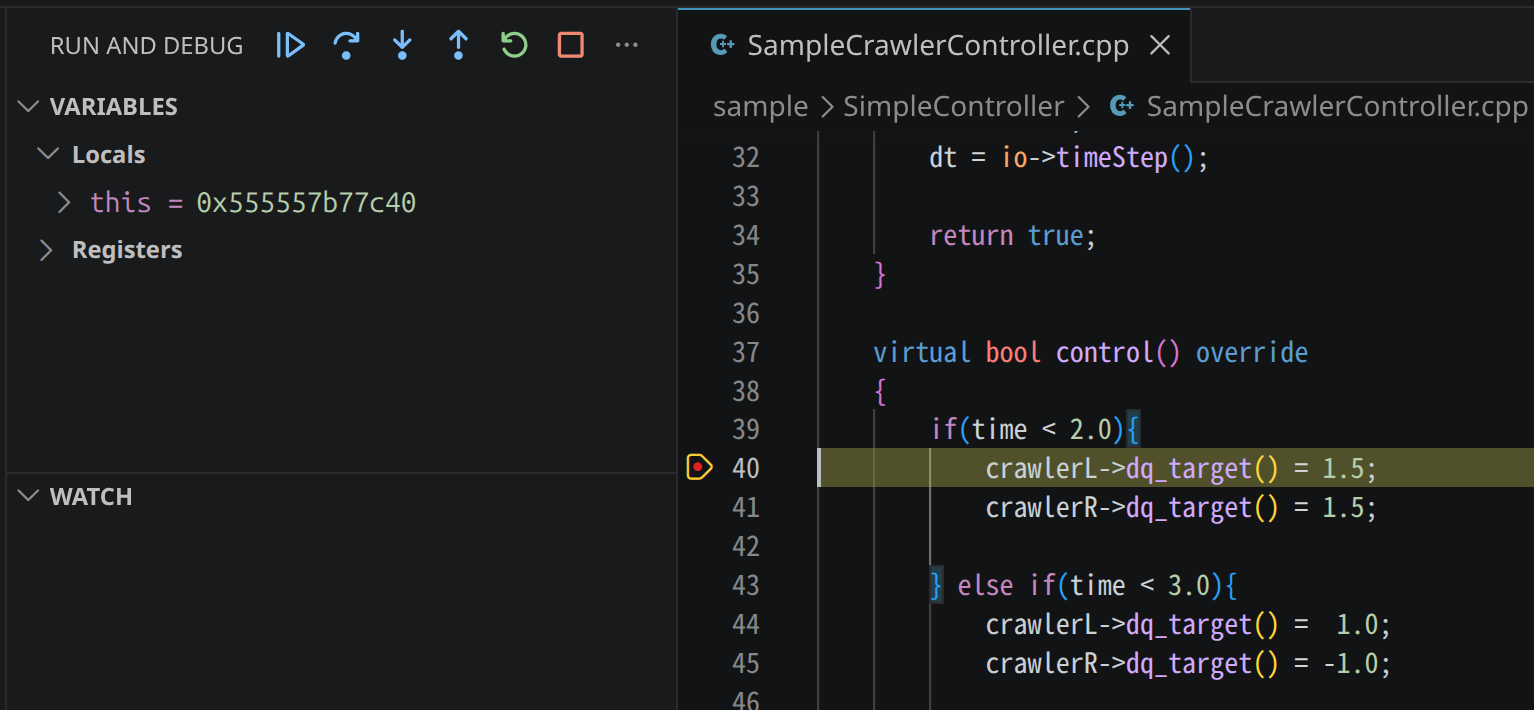
The VARIABLES panel lists the variables accessible at the point where execution stopped at the breakpoint (local variables, members of the this pointer, and so on). Objects can be expanded to check their contents. For objects that have a base class, the base class is also displayed as a node and its members can be expanded.
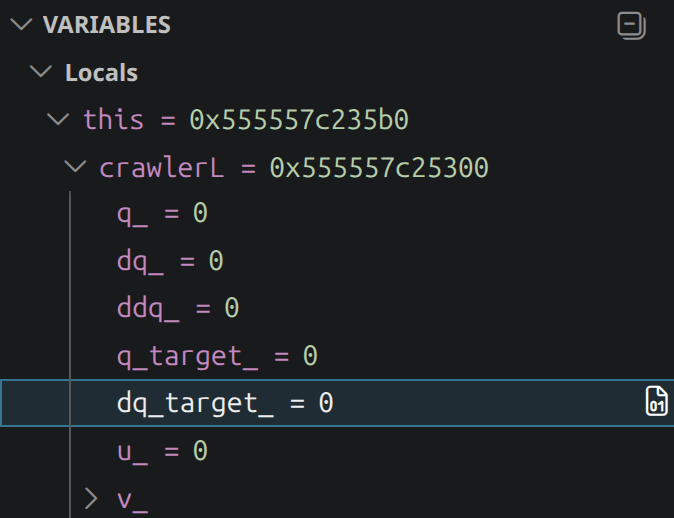
Here let us check the value of crawlerL that appears on line 40. Since crawlerL is a member variable of the SampleCrawlerController class, it is contained within the expansion of this. Click the ▸ to the left of this in the VARIABLES panel to expand it, and then further expand crawlerL inside it. You can check the member variables of crawlerL as shown below. Among them, dq_target_ is the value referenced by crawlerL->dq_target() in the code, and at this point it is 0.
Stepping Through Code
From the state where execution is stopped at the breakpoint, let us execute the program one line at a time.
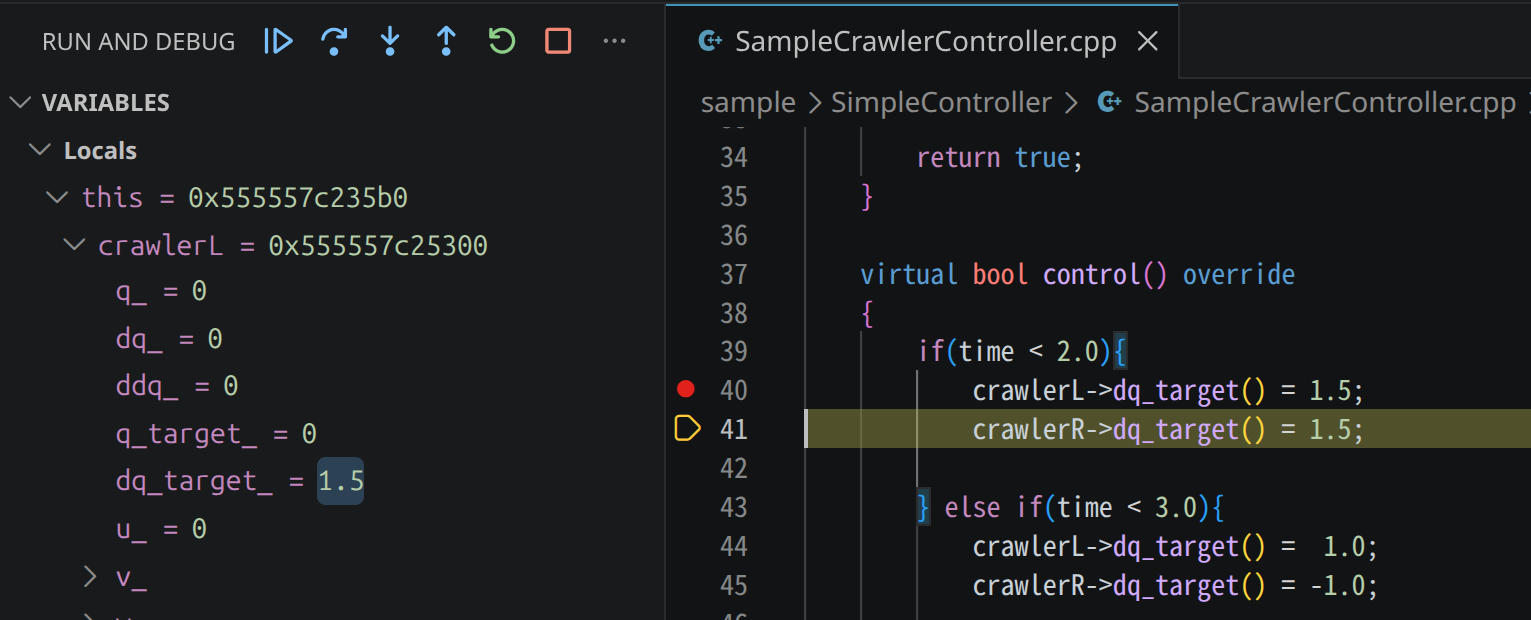
Press Step Over (F10) in the debug button group at the top of the Visual Studio Code window. After line 40 is executed, execution stops again at the next line.
If you now check the value of dq_target_ in crawlerL in the VARIABLES panel in the same way as before, you will see that the value is 1.5, indicating that the value was updated by the processing on line 40.
Tips for Displaying Variables
In addition to the basic operations above, this section describes more convenient features for checking variables and techniques for special cases.
Using the WATCH Panel
When you want to continuously monitor the value of a specific expression, it is convenient to register the expression in the WATCH panel. Press the + button on the WATCH panel and enter an expression; the expression will be evaluated and its value displayed each time the program stops.
For example, the dq_target_ of crawlerL that we checked earlier by traversing the VARIABLES panel can be displayed directly as the return value of the accessor function dq_target() by registering
this->crawlerL->dq_target()
in the WATCH panel. You no longer need to expand this in the VARIABLES panel each time, which is effective when there are values you want to monitor frequently.
In particular, the WATCH panel makes it easy to reference values that are difficult to check directly in the VARIABLES panel, such as those described below.
Displaying the Contents of STL Containers
When -enable-pretty-printing is not enabled, STL containers such as std::string and std::vector are displayed as their internal structure, and expanding them in the VARIABLES panel does not make the contents intuitively readable. You can check their contents by registering expressions like the following in the WATCH panel.
Example of displaying the string content of std::string
str.c_str()
Example of displaying all elements of std::vector (using gdb’s array display notation)
vec._M_impl._M_start@vec.size()
Example of displaying what std::shared_ptr or std::unique_ptr points to
ptr.get()
Members of Classes Implemented with the Pimpl Idiom
Some classes in Choreonoid adopt the Pimpl idiom to hide implementation details, separating member variables into an Impl class. Because the Impl class is only forward-declared in the header file and defined in the .cpp file, its type information is not visible from other translation units, and the variables panel cannot show the contents even if you expand the impl pointer.
This restriction stems from the format of the debug information (on Linux, DWARF is split per translation unit) and cannot be resolved by changing debuggers. As workarounds, you can do either of the following:
Place a breakpoint inside the
.cppfile of the class in question, and check the variables when execution stops thereIf the class provides accessor functions, register calls to those functions in the WATCH panel (e.g.,
item->name())
Calling Accessor Functions of Objects
In an expression registered in the WATCH panel, you can also call functions inside the process being debugged and display the result. You can use this to check the state of an object through its accessor functions.
item->name()
item->filePath()
body->link(0)->p()
However, note that if the function being called has side effects (modifying members, acquiring locks, throwing exceptions, and so on), it may affect the state of the process being debugged. Basically, it is safe to call only const functions that do not change state.